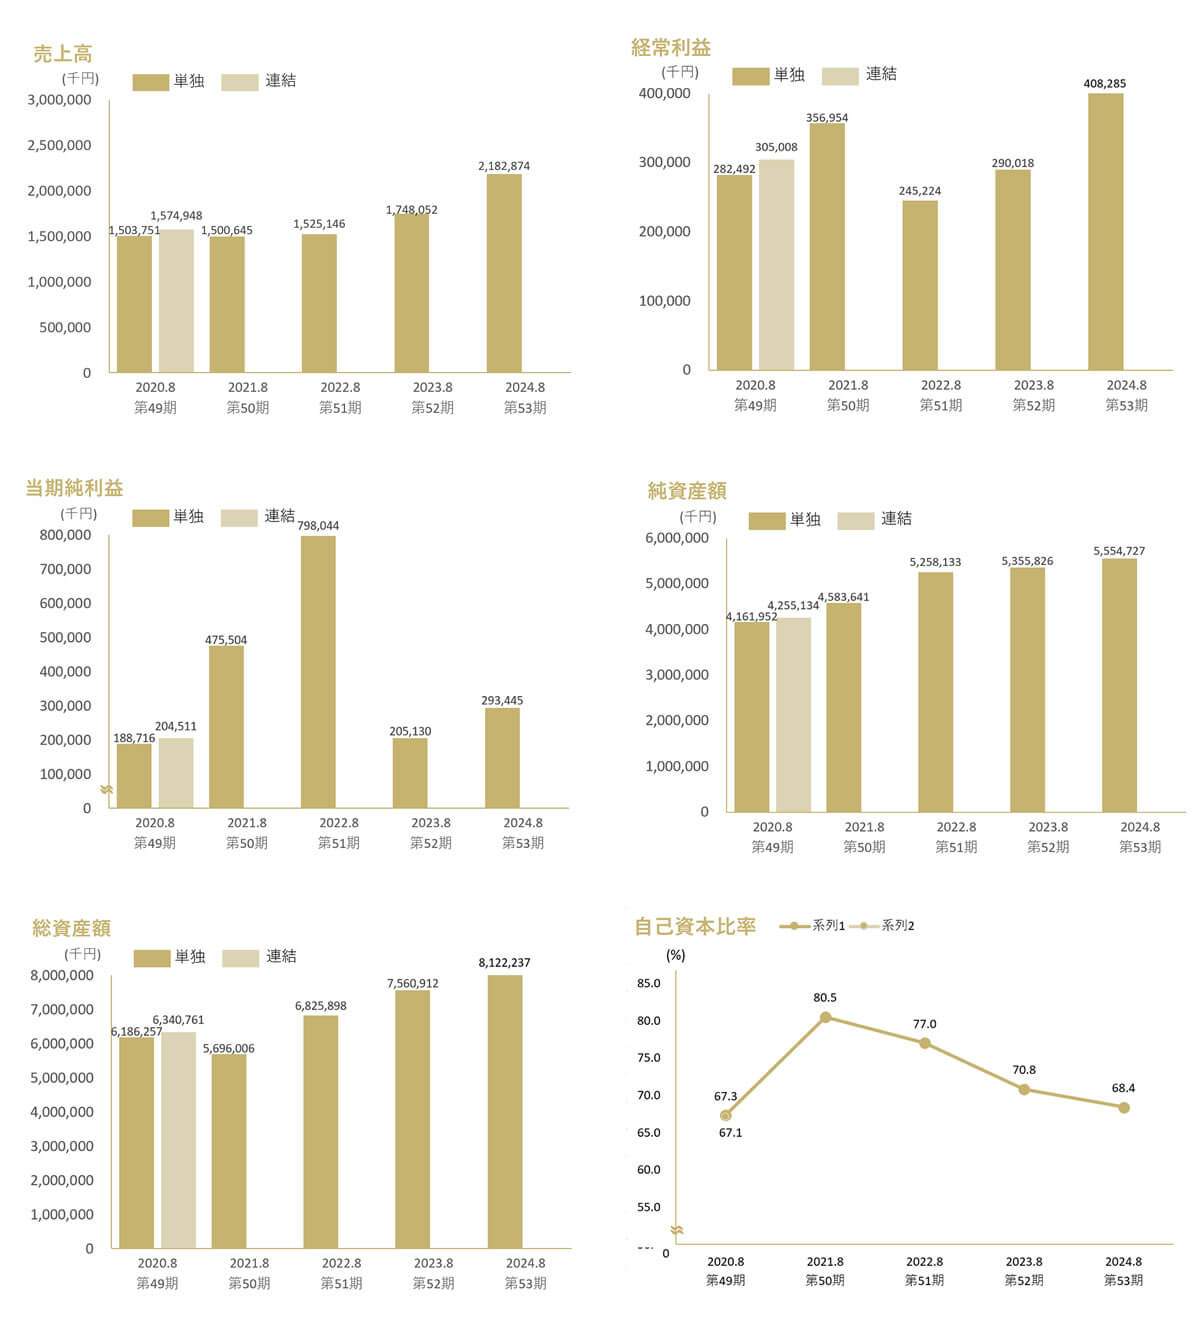
Financial
Performance

| (Unit) | 2020.8 49TH | 2021.8 50TH |
2022.8 51TH |
2023.8 52TH |
2024.8 53TH |
|
|---|---|---|---|---|---|---|
| Non-consolidated | Consolidated | Non-consolidated | Non-consolidated | Non-consolidated | Non-consolidated | |
| Sales(Thousand yen) | 1,503,751 | 1,574,948 | 1,500,645 | 1,525,146 | 1,748,052 | 2,182,874 |
| Ordinary profit(Thousand yen) | 282,492 | 305,008 | 356,954 | 245,224 | 290,018 | 408,285 |
| Net income(Thousand yen) | 188,716 | 204,511 | 475,504 | 798,044 | 205,130 | 293,445 |
| Capital(Thousand yen) | 564,300 | – | 4,300 | 4,300 | 4,300 | 4,300 |
| Total number of issued shares(Stock) | 2,901,000 | – | 2,901,000 | 2,901,000 | 2,901,000 | 2,901,000 |
| Net Assets(Thousand yen) | 4,161,952 | 4,255,134 | 4,583,641 | 5,258,133 | 5,355,826 | 5,554,727 |
| Total Assets(Thousand yen) | 6,186,257 | 6,340,761 | 5,696,006 | 6,825,898 | 7,560,912 | 8,122,237 |
| Equity Ratio(%) | 67.3 | 67.1 | 80.5 | 77.0 | 70.8 | 68.4 |
※As the company became an unconsolidated company due to an absorption-type merger with a subsidiary on December 1, 2020, it has been disclosed on a standalone basis since the 50th fiscal year.
※If you are viewing on a tablet or smartphone, please scroll horizontally.
